Plus500 tutorial: how can you trade on Plus500?
In this article you will learn how to actively invest in CFDs on stocks, commodities, currencies and cryptocurrencies using Plus500 (Instrument availability subject to regulations). In the first part of the Plus500 manual, we discuss how the Plus500 software works. We will explain how you can open your first trade with Plus500. In the second part of the tutorial we look at how you can make trading decisions.
Open a free demo account
Before you can get started with this manual, you first need a free demo account on Plus500. When you open an account with Plus500, you receive a virtual amount with which you can immediately start trading CFD shares. The results you get with the demo show how you would do if you actually deposit money. With the button below you can directly open a free account on Plus500:
Opening a demo account with Plus500 is an easy process. You just need to enter an email address and password. After you have done this you can start immediately.

How can you start trading with Plus500?
If you are new to Plus500, it may take some getting used to. In the first part of the tutorial, we look at how to use the software to open your first trade. Here you can see how the Plus500 WebTrader looks like:

Illustrative prices.
On the left of the screen you can find a CFD in which you can trade with the categories. You can also use the search falcon to find a specific CFD.

When you want to open a position, you click on buy or sell. This way you open the order screen on Plus500. You can immediately start trading within the order screen.

Illustrative prices.
You must always indicate with what amount you want to trade. For example: if you want to trade CFD shares, choose the number of shares on which you want to open a position. When you press buy, the position is executed immediately.
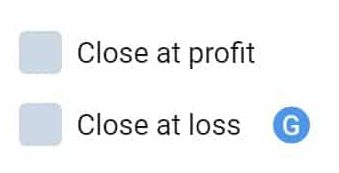
Tip: automatically close positions on loss/profit
It’s advisable to close your trading positions automatically when you have reached a certain profit or a certain loss. In the order screen you can indicate this by entering automatic closing for profit and loss.

Illustrative prices.
The moment you automatically take your loss is not 100% guaranteed. When the market suddenly moves strongly, you can lose more money than the amount you indicate there. Do you no longer want to lose the amount you set? Then you can use the guaranteed stop loss.
How can you place an order with Plus500?
Within the Plus500 software it is also possible to place an order. An order ensures that your trade is opened automatically when the price you set is reached. To set an order, press advanced within the order screen and then buy as the price. Here you can then set the value at which you automatically open a position.

Illustrative prices.
After you have placed an order, you can find it under open positions. Here you can cancel the order or adjust the moment when you take your loss or take a profit.
Tip: using trailing-stop
You can also use a trailing stop at Plus500. A trailing stop is a moving level at which you close the position automatically. You set at which level this stop should be set. This could be $5 below the current share price for example. The level then moves as the share price moves in the profitable direction. When the price of the share increases by $ 3, the level of the stop also increases by $ 3.
You can use a trailing stop to take full advantage of an upward trend. It is sometimes difficult to predict when the price will move back. With a trailing stop you prevent losing profits and at the same time you protect your position.
How do you manage trades on Plus500?
After you have opened a trade, you can find it under open positions. It is important to understand how the result of a trade is tracked. Next to the position you will see a negative or a positive number. This number indicates whether your position is currently at a loss or profit. The result of the investment is only final when you close the position. Until then, the result of your position has not yet been decided.
You should always have enough money in your trading account: if this is not the case, you can lose the entire position.
On Plus500 it is also possible to speculate on falling share prices. With each asset you can click on two buttons: buy and go short. When you press the buy button, you get a positive result with a rising price and a negative result with a falling price. When you press the sell button you achieve a positive result with a falling price and a negative result with a rising price.
The possibility to also place orders on falling prices greatly increases your flexibility. However, it is important to take into account that the theoretical loss on a short position is unlimited. The price does not usually fall below zero, but it can rise infinitely. With Plus500 you have advanced risk management tools at your disposal.
 How can you use leverage with Plus500?
On Plus500 you have the option to apply leverage to your trades. You then trade on a margin. The use of a leverage can make it possible to take large positions with a small amount. The use of leverage also carries additional risks. But how does trading with leverage with Plus500 work exactly?
You can use a different maximum leverage with each CFD. When the maximum leverage is 1:10, you can make a trade of $10,000 with an amount of $1,000. Plus500 then finances the extra $9,000. When you apply this leverage, both your gains and losses increase faster. Without leverage, an increase of $100 would result in:
- A profit of 100 on a buy position
- A loss of €100 on a sell position
With a leverage of 1:10, these gains and losses increase a lot faster. At an increase of $100 you would:
- Achieve a profit of $1000 on a buy position.
- Achieve a loss of $1000 on a short position.
You must always ensure that there is sufficient money in your account. When you trade with a leverage of 1:10, you can already lose the full amount in your account when the price drops 10%. Do you want to know in detail how trading with leverage works on Plus500? Then read the articles trading with leverage and trading with margin on Plus500.
How can you deal with your risks when trading?
Thanks to this guide, you now know how to open a trade within the Plus500 platform. In the rest of the tutorial we look at how to make trading decisions. By paying close attention, you reduce the chance of losing your entire deposit on your trading activities.
If you want to achieve good results with your trades at Plus500, it’s important to keep a close eye on your risks. Many new users lose money because they forget to properly manage their risks.
In order to achieve a good result, you must ensure a good division between risk and return. A trade with a potential profit of $ 1 and a potential loss of $ 10 is not very interesting. A trade with a potential profit of $10 and a potential loss of $1 is interesting.
If you ensure that your positions potentially yield more profit than loss, you can achieve good results. After all, you need to make the right decision in less than half of the cases. Therefore, only open trades with a favourable balance between risk and return.
When do you start trading?
When you decided to start trading it’s important to do this with a plan. Opening positions without good considerations often leads to a great loss. Therefore, before opening a position, consider the following:
- Why do you want to open a position in this CFD?
- At what price would you take a profit?
- At what price would you take a loss?
By thinking this up in advance, you avoid making wrong decisions under the influence of emotions. You can make these decisions in different ways. Examples of popular analysis techniques are:
- Fundamental analysis: in which you examine the underlying figures.
- Sentimental analysis: where you think about what the masses would do.
- Technical analysis: where you examine patterns in the graph.
How does fundamental analysis work?
With fundamental analysis you analyse the figures behind a CFD. When you trade in shares, these can be the annual accounts. When you trade in a currency pair, these can be the economic numbers of an entire region. You must remember that the price of a share has already been determined under the influence of the information that the financial markets have at this moment.
When new figures turn out to be more positive than expected, the prices rise and when the figures turn out to be more negative than expected, the prices fall. In fundamental analysis, it is therefore important to estimate the impact of certain figures. When new data is released you often see a lot of volatility that you as a trader can take advantage of.
How does sentimental analysis work?
When you mainly do sentimental analysis, you try to analyse the situation from the perspective of the average trader. Certainly, in the cryptocurrency market you can see that many traders are quite amateurish. They speculate on the price of the Bitcoin hoping to make a nice profit.
This shows that traders can sometimes panic quickly. When the car brand BMW had cheated with emissions, you saw that the price of the share immediately collapsed. When China indicated that it wanted to ban cryptocurrencies, you saw that the price fell sharply. You often see a good recovery after a crash influenced by panic.
As a trader you can respond to this by remembering that prices on the market are only established through the law of supply and demand. The price on the stock exchange does not therefore have to indicate the actual value of, for example, a share. When you start trading in CFDs, you should try to empathize with the average investor. Try to predict what the average investor will do and take your trades based on this information.
How does technical analysis work?
Most traders use technical analysis when they are actively speculating or trading the markets. When you use technical analysis, you only use the graph on the screen. The fundamentals or the feelings of other investors are not used when you use technical analysis.
The simplest form of technical analysis is simple pattern recognition. You intuitively watch how the price develops and you buy at the lowest points and you sell at the highest points. This sounds simple, but in practice there is a bit more to it. In the rest of this Plus500 manual, we will explain how you can make trading decisions based on technical analysis.
Determine the trend
A good first step when trading is to identify the trend. There are roughly three types of trends. We call the first type the uptrend. When a market is in an uptrend, the price mainly moves upwards.

Not everything rises, of course: when prices mainly fall, we speak of a downtrend.

The direction is less clear in some markets. The buyers and sellers are engaged in a fierce battle and the price is bouncing up and down. We call this market situation a consolidation.

Trading within the trend
If you want to achieve good results with your trades, it is wise to trade in the direction of the trend. When there is an uptrend you buy and when there is a downtrend you sell.
Within an uptrend, you obviously don’t want to buy when the price is at a peak. You do this precisely when the price just drops slightly. Below you can see what this looks like:

You can do the opposite within a downtrend. You go short when the price has just risen again. By going short you achieve a positive result when the price of the asset decreases.
In an indeterminate market where the price is constantly moving between two points, you can buy or short sell. It is wise to buy at the lower level and to sell at the higher level.
Recognize horizontal levels
You can draw horizontal levels within the Plus500 software. You do this by using the drawing tool within the software:

You normally draw a horizontal level in a place where the price bounces several times. These are often great times to open an investment. If you want even more confirmation you can also use candlesticks. In the last part of the Plus500 manual, we will discuss how you can use candlesticks to make trading decisions.

How to read and use candlesticks when trading
A candlestick gives you more information about the price trend than a normal line. Before you can use this, you must first enable the candlesticks within the software. You can do this by pressing this button within the software:

Now it is still important to understand how to read a candlestick. We distinguish two parts:
- Body: the coloured body of the candlestick.
- Stick: the protruding thin part of the candlestick.
The body indicates at what price the market has opened and closed within the time period to which the candlestick relates. The stick shows the total price range on that day. The colour indicates whether the price has gone up or down. A green colour indicates an increase and a red colour indicates a decrease.
When the colour is red, the highest part of the body is the opening price and the lowest part is the closing price. When the colour is green, the lowest part of the body is the opening price and the highest part is the closing price.
These candlesticks indicate a clear trend
Below we discuss candlesticks that indicate a clear price movement.
High test / low test

In a low test the opposite applies. The body is located in the top 1/3 of the bar. This candle shows a clear battle between the buyers and sellers that has been lost by the sellers. This can be a clear buy signal.
Bullish / bearish engulfing bar

A bullish engulfing bar is the complete opposite of this. This combination consists of two candlesticks. The first bar is a falling candlestick. This is followed by a rising candlestick with the body ending higher than that of the first bar. This is a strong buy signal.
These candlesticks do not indicate a clear trend
Below we discuss candlesticks that do not indicate a clear price movement. After a period of indecision, a significant move often follows.
Doji bar

Inside bar

Start trading now!
You now know enough to start trading with Plus500. You can apply all learned information directly with the free unlimited demo. It is important to keep an eye on the risks and to apply a good strategy. By using different strategies, you will automatically discover which trading method works best for you. Use the button below to start practising with a free demo right away:
This post is also available in: English Nederlands Español Čeština polski Română Svenska Italiano Deutsch العربية עברית Português Русский Dansk فارسی Norsk bokmål Français 简体中文 繁體中文